| BUOY ROUNDUP
Sunday, May 17, 2026
:
- Buoy 239 (Lani)/Buoy 238 (Barbers Pt): Seas were 4.0 ft @ 15.43 secs with swell 1.7 ft @ 15.4 secs from 201 degrees. Water temp 78.4 (Barbers Pt), 78.6 (Pearl Harbor 233), 78.6 (Lani 239), 76.1 (Hanalei).
- Buoy 187 (Pauwela): Seas were 6.4 ft @ 9.1 secs with swell 5.0 ft @ 8.7 secs from 68 degrees. Water temp 76.8 degs.
- Buoy 106 (Waimea)/Buoy 202 (Hanalei): Seas were 4.1 ft @ 7.7 secs with swell 2.7 ft @ 8.3 secs from 105 degrees. Water temp 77.9 degs
- Buoy 46025 (Santa Monica Basin): Seas were 5.4 ft @ 7.1 secs with swell 3.6 ft @ 8.3 secs from 271 degrees. Wind north 10-12 kts. Water temperature 63.5 degs, 55.4 (Harvest 071), 64.4 (Topanga 103), 62.6 (Long Beach 215), 65.5 (Oceanside Offshore 045), 66.4 (Del Mar 153), 66.0 (Torrey Pines Outer 100). At Harvest Buoy (071) primary swell was 12.9 ft @ 9.8 secs from 312 degrees. At E. Santa Barbara (46053) swell was 3.4 ft @ 12.5 secs from 303 degrees. At Santa Monica (028) swell was 2.8 ft @ 8.6 secs from 261 degrees. At Green Beach (271) swell was 2.1 ft @ 13.6 secs from 205 degrees. At Oceanside (045) swell was 2.2 ft @ 9.4 secs from 266 degrees. Southward at Pt Loma (191) swell was 5.7 ft @ 10.0 secs from 280 degrees. Water temperature 65.7 degrees.
- Buoy 029 (Pt Reyes)/Buoy 157 (Pt Sur): Seas were 17.0 ft @ 11.1 secs with swell 12.9 ft @ 10.1 secs from 315 degrees. Wind northwest 23-27 kts (San Francisco 46026), NW 27-33 kts (Bodega Bay 46013), NW 31-39 (Half Moon Bay 46012) and W 12 (Monterey Bay (46092). Water temp NA (Bodega Bay 46013), 50.2 (Pt Reyes 029), 49.3 (San Francisco 46026), 56.5 (SF Bar 142), 51.3 (Half Moon Bay 46012), 50.7 (Monterey Bay 46092), 51.8 (Monterey Outer Canyon 156).
Swell Classification Guidelines
Significant: Winter - Swell 8 ft @ 14 secs or greater (11+ ft faces) for 8+ hours (greater than double overhead).
Summer - Head high or better.
Advanced: Winter - Swell and period combination capable of generating faces 1.5 times overhead to double overhead (7-10 ft)
Summer - Chest to head high.
Intermediate/Utility Class: Winter - Swell and period combination generating faces at head high to 1.5 times overhead (4-7 ft).
Summer - Waist to chest high.
Impulse/Windswell: Winter - Swell and period combination generating faces up to head high (1-4 ft) or anything with a period less than 11 secs.
Summer - up to waist high swell. Also called 'Background' swell.
Surf Heights for Hawaii should be consider 'Hawaiian Scale' if period exceeds 14 secs.
PACIFIC OVERVIEW
Current Conditions
On Sunday (5/17) in North and Central CA surf was 1-2 ft overhead and weakly lined up and mushed and warbled with chop over outer waters. Protected breaks were head high and lined up and closed out and warbled. At Santa Cruz surf was head high if not a little more and lined up on the sets and clean but with some intermixed warble. In Ventura County the surf was waist to chest high on the sets and reasonably lined up with decent form but some sections and a bit warbled. Central Orange County had sets at chest to head high and lined up with decent form but pretty warbled from southerly winds early. South Orange County's best summertime breaks had sets at waist to chest high on the rare sets and somewhat lined up and soft and warbled early. North San Diego had sets at waist to chest high and lined up with occasional sections but warbled and mushed. Oahu's North Shore had a few waist high sets and lined up and fairly clean but with some intermixed warble. The South Shore had sets at chest high and reasonably lined up with decent form when the sets came and clean but inconsistent early. The East Shore was getting easterly tradewind generated windswell at waist to near chest high and somewhat warbled but with light east trades early.
See QuikCASTs for the 5 day surf overview or read below for the detailed view.
Meteorological Overview
On Sunday (5/17) Hawaii was getting no swell of interest. California was getting background southern hemi swell buried in far larger locally generated northwest windswell. Up north a gale developed west of the dateline lifting northeast Wed-Thurs (5/14) with 29 ft seas aimed east then is to cross the dateline and track east to the Northwest Gulf Fri-Sat (5/16) with 25-28 ft seas aimed east. Maybe some swell to result for HI and CA. Up north the model is hyping development of a stronger gale in the Northwestern Gulf tracking east Sat-Sun (5/24) with up to 31 ft seas aimed east. And down south similarly the model is suggesting a large gale developing southeast of New Zealand Sat-Sun (5/24) with 38 ft seas aimed northeast. An interesting uptick in swell energy is possible both north and south.
See all the details below...
SHORT- TERM FORECAST
Current marine weather and wave analysis plus forecast conditions for the next 72 hours North Pacific Overview
Jetstream
On Sunday (5/17) the jetstream was consolidated running east across the North Pacific on the 47N latitude line with winds to 160 kts in a pocket over the dateline but otherwise 120 kts and no trough indicated offering no clear support for gael formation. Over the next 72 hours more of the same is forecast but with building to 160 kts over the jet from Japan to the Northwestern Gulf but again no troughs forecast. Beyond 72 hours starting Wed (5/20) that wind energy is to start migrating east, fading some on Fri (5/22) then rebuilding from the west initially over the dateline Sat (5/23) moving fast to the east and over the Gulf on Sun (5/24) with 170 kt winds digging out a bit of a trough possibly supporting gale formation.
Surface Analysis
On Sunday (5/17) swell from a gale that developed over the dateline is to be propagating southeast towards Hawaii and CA (see Dateline Gale below). .
Over the next 72 hours no swell producing fetch of interest is forecast.
Dateline Gale
On Wed PM (5/13) a gale started building west of the dateline lifting northeast with southwest winds 40 kts and seas building from 22 ft at 41N 166E aimed east. On Thurs AM (5/14) the gale was moving east over the dateline with 40 kt west winds and seas 27 ft at 44N 172E aimed east. In the evening the gale was tracking east over the dateline with 35-40 kts west winds and seas 29 ft at 46N 178.5E aimed east. On Fri AM (5/15) the gale was over the Northwestern Gulf with west winds 35-40 ks and seas 29 ft at 46.5N 174.5W aimed east. In the evening the gale was fading just south of the East Aleutians with west winds 30-35 kts and seas 26 ft at 50.25N 168.25W aimed east. The gale faded Sat AM (5/16) over the East Aleutians with west winds 30 kts and seas fading from 23 ft at 52.25N 164W aimed east. Something to monitor.
Hawaii: Expect minimal swell arrival on Mon (5/18) building to 0.8 ft @ 12-13 secs later (1.0 ft). Swell fading Tues (5/19) from 1.4 ft @ 11 secs (1.0-1.5 ft). Swell Direction: 320 degrees
North CA: Expect swell arrival on Tues (5/19) building to 3.1 ft @ 14-15 secs later (4.0-4.5 ft) and likely buried in locally generated northwest windswell. Swell to be fading Wed (5/20) from 3.2 ft @ 13 secs early (4.0 ft) still buried. Swell Direction: 300 degrees
North Pacific Animations: Jetstream - Surface Pressure/Wind - Sea Height - Surf Height
Tropical Update
No tropical systems of interest were being monitored.
California Nearshore Forecast
(North CA is defined as the area north of the Golden Gate - Central CA from Pt Conception to the Golden Gate, and Southern CA everywhere south of Pt Conception).
- Mon AM (5/18) the gradient lifts north some and fades with northwest winds 25-30 kts for North CA and 20 kts for Central CA down to Monterey Bay and 15 kts south of there but 25 kts well offshore. In the afternoon northwest winds to be 25-30 kts for North CA and 15 kts for Central CA but 10 kts south of Monterey Bay. No precip forecast.
- Tues AM (5/19) the gradient continues lifting north with northwest winds 25 kts centered on Pt Arena and 15 kts down to the Golden Gate and 10 kts for Central CA. In the afternoon northwest winds to be 25 kts for Cape Mendocino and 15 kts for the rest of North CA and 5-10 kts for Central CA. No precip forecast.
- Wed AM (5/20) northwest winds to be 25-30 kts for Cape Mendocino and 20 kts down to Pt Arena and northwest 15 kts south to the Golden Gate and 10-15 kts for Central CA. In the afternoon northwest winds to be 25-30 kts for most of North CA but 15 kts from Pt Arena down to Bodega Bay and then 10 kts south of there down over all of Central CA. No precip forecast.
- Thurs AM (5/21) the gradient stabilizes over Cape Mendocino with northwest winds 25-30 kts and northwest 15 kts south of Pt Arena and northwest 5-10 kts for Central CA. In the afternoon northwest winds to be 25-30 kts limited to Cape Mendocino and 10 kts south of there and northwest 5 kts for Central CA. No precip forecast.
- Fri AM (5/22) northwest winds to be 25+ kts for Cape Mendocino and northwest 5-10 kts south of Pt Arena and northwest 5-10 kts for Central CA. In the afternoon no change is forecast but with northwest winds fading to 20+ kts for Cape Mendocino. No precip forecast.
- Sat AM (5/23) northwest winds to be 20-25 kts for North CA but 15 kts south of Pt Arena and northwest 5-10 kts for Central CA. No change in the afternoon. No precip forecast.
- Sun AM (5/24) northwest winds to be 20-25 kts for Cape Mendocino and 15 kts south of there to the Golden Gate and northwest 10 kts for Central CA. No precip forecast.
Sierra Snow Forecast: (focused on Olympic Valley): Freeze level 7,000 ft Mon AM (5/18) rising to 8,500 ft later 10,500 ft Tues (5/19), rising to 12,000 ft Wed (5/20) then holding there or up to 12,500 ft beyond. Snow accumulation for Olympic Valley: 0 inches. Mammoth: 0 inches
- - -
Tioga Pass/Pacific Crest Trail intersection forecast: Temps - Freeze Level
More locations here (scroll down to 'Resort Snow Forecasts>Central CA or North CA Caltrans & Backcountry')
Snow Models: http://www.stormsurf.com/mdls/menu_snow.html (Scroll down for Resort specific forecasts).
South Pacific
Overview
Surface Analysis
On Sunday (5/17) swell from the 3rd in a series of gales was all but gone in California (see Central South Pacific Gale below).
Over the next 72 hours no swell producing fetch of interest is forecast.
3rd Gale- Central South Pacific
Another gale developed Sat AM (5/2) over the Central South Pacific with southwest wind 50-55 kts over a tiny area and seas building from 33 ft at 52S 152.25W aimed east. In the evening the storm was falling southeast with 55 kt southwest winds and seas building from 37 ft at 54.75S 136W aimed northeast. On Sun AM (5/3) the gale was falling southeast over the Southeast Pacific with west to southwest winds 50-55 kts and seas 40 ft at 58S 126.25W aimed east. In the evening the gale is to continue southeast with 50 kt west winds and seas 40 ft at 58.25 117.75W aimed east and just barely east of the Southern CA swell window. The gale to fade from there. Something to monitor.
Southern CA: Dribbles Sun (5/17) from 1.8 ft @ 13-14 secs (2.0-2.5 ft). Swell Direction: 200 moving to 195 and then 190 degrees
North CA: Dribbles Sun (5/17) from 1.8 ft @ 13-14 secs (2.0-2.5 ft). Swell Direction: 200 moving to 190 degrees
South Pacific Animations: Jetstream - Surface Pressure/Wind - Sea Height - Surf Height
LONG-TERM FORECAST
Marine weather and forecast conditions 3-10 days into the future North Pacific Beyond 72 hours starting Fri AM (5/22) theoretically a small gale is to be building on the dateline producing northwest winds at 35 kts trying to get some traction. In the evening the gale is to race east to the Northwestern Gulf with northwest winds 35 kts and seas still trying to build. On Sat AM (5/23) northwest to west winds to start building to 40-45 kts in the Northwest Gulf with seas building from 23 ft at 46N 167.5W aimed east. In the evening the gale is to build while slowly tracking east with northwest winds 40-45 kts and seas 27 ft at 48.5N 158W aimed east. Sun AM (5/24) west winds to be 40 kts solid in the Northeast Gulf with seas 29 ft at 50N 149.5W aimed east building to 31 ft 6 hours later. Something to monitor but probably just a fantasy of the model.
South Pacific
Beyond 72 hours starting Fri AM (5/22) a huge fetch of west winds are to start building south of New Zealand at 35-40 kts with seas building from 28 ft at 60.5S 154.25E aimed east. In the evening fetch is to build at 40-45 kts over a solid area aimed east-northeast with seas 34 ft at 57.25S 173E aimed east-northeast. On Sat AM (5/23) 40-45 kts southwest winds to be over a large area southeast of New Zealand with seas building to 38 ft at 56S 178.5W aimed northeast. In the evening fetch is to be lifting northeast at 40+ kts still over a large area with seas 38 ft at 51.75S 167.5W aimed northeast. Sun AM (5/24) fetch is to be lifting northeast at 35-40 kts over a large area with seas 36 ft at 48.5N 160.75W aimed northeast. Something to monitor.
MJO/ENSO Forecast El Nino Developing
Large Kelvin Wave #3 Poised to Erupt over Ecuador
In Nov '25 westerly anomalies associated with Active Phase of the MJO #1 took root producing a Kelvin Wave pushing warm subsurface waters east. In early January strong Active MJO #2 started producing a second WWB in the far West Pacific producing Kelvin Wave #2. Kelvin Waves #1 & #2 started impacted Ecuador in March. And in late Feb Active Phase #3 developed with strong west anomalies holding into 4/15. Large Kelvin Wave #3 is either poised to or is starting to erupt over Ecuador. Lower pressure is building over the dateline and high pressure is building over the Maritime Continent. A full turn to El Nino is setting up over the equatorial Pacific.
MJO/ENSO Discussion
The Madden Julian Oscillation (MJO) is a periodic weather cycle that tracks east along the equator circumnavigating the globe. It is characterized in it's Inactive Phase by enhanced trade winds and dry weather over the part of the equator it is in control of, and in it's Active Phase by slackening if not an outright reversing trade winds while enhancing precipitation. The oscillation occurs in roughly 20-30 day cycles (Inactive for 20-30 days, then Active for 20-30 days) over any single location on the planet, though most noticeable in the Pacific. During the Active Phase in the Pacific the MJO tends to support the formation of stronger and longer lasting gales resulting in enhanced potential for the formation of swell producing storms. Prolonged and consecutive Active MJO Phases in the Pacific help support the formation of El Nino. During the Inactive Phase the jet stream tends to split resulting in high pressure and less potential for swell producing storm development. Wind anomalies in the Kelvin Wave Generation Area (KWGA) are key for understanding what Phase the MJO is in over the Pacific. The KWGA is located on the equator from 135E-170W and 5 degs north and south (or on the equator from New Guinea east to the dateline). West wind anomalies in the KWGA suggest the Active Phase of the MJO in the Pacific, and east anomalies suggests the Inactive Phase. In turn the Active Phase strengthens and the Inactive Phase weakens the jetstream, which in turn enhances or dampens storm production respectively in the Pacific.And the El Nino/La Nino cycle (collectively know as ENSO - El Nino Southern Oscillation) is a less frequent (about once every 7 years) but more impactful cycle that affects world wide weather. Specifically, strong El Nino events promote storm production in the Pacific while La Nina events suppress storm production. These therefore have a significant impact on the production of swell and surf. The paragraphs below analyze the state of the MJO and ENSO in the Pacific and provide forecasts for upcoming activity (or inactivity depending on the state and interaction of these two oscillations).
Longterm Swell Forecast Overview (updated 3/29/26): In 2022 La Nina evolved with easterly anomalies over the equatorial Pacific and cooler water at the surface off Ecuador. That pattern continued until late Fall 2022 when trades started fading and by early 2023 multiple Active Phases of the MJO produced several Westerly Wind Bursts (WWB) and Kelvin Waves pushing east resulting in significant oceanic warming over the East Equatorial Pacific. La Nina was dead on 3/18/2023 with El Nino apparently developing. But it was not coupled with the atmosphere by late July, and that spelled the demise of that event. There is growing suspicion the Hunga Tonga volcano eruption (1/15/2022) muted El Ninos impact. The fading of this El Nino only resulted in the buildup of more latent heat energy in the ocean. By Jan 2024 the first signs of the normal reaction to El Nino (failed or not) resulted, with La Nina emerging, but never developed more than Modoki status through Fall 2025. And then in Dec 2025, an Active Phase of the MJO developed with westerly anomalies producing a small Kelvin wave, followed by a slightly stronger one in Feb 2026. And then on March 8, westerly anomalies started building in earnest in the far West Pacific, building to strong status in late March suggesting something more was occurring. The buildup of latent heat energy in the planets ocean seems to ensure it will not be denied.
LONG-RANGE PACIFIC STORM AND SWELL GENERATION POTENTIAL FORECAST |
Summer 2026 = 5.0 (California & Hawaii)
Rating based on a 1-10 scale: 1 being the lowest (small and infrequent surf conditions), 5 being normal/average, and 10 being extraordinary (frequent events of large, long period swells) |
Rationale: A Modoki La Nina developed in the Fall/Winter of 2024-25. It faded in Summer of 2025 then started turning toward La Nina again in Aug 2025. Considering it takes 3+ months for La Nina symptoms to appear in the atmosphere after the ocean (Nino 3.4) turns solidly to a La Nina configuration, and the ocean was just starting to make clear moves towards becoming solidly La Nina in late Aug, some form of weak La Nina built into the jetstream/atmosphere in late Fall (Dec 2025). But at the surface in the West Pacific a series of 3 Westerly Wind Bursts (WWB) occurred (Dec 26, Feb and then March 2026). Note that the PDO was still be in the cool phase in Fall/Winter 2025-26 but was showing signs of turning neutral as of the time of this writing (3/29/26). The two big unknowns are what will the PDO do (will it overwhelm whatever push there is towards and ENSO) and how much if any of Hunga Tonga volcanoes effect linger in the atmosphere?
Regardless, clear signs of the development of El Nino are present in the West Pacific and are starting to affect surface water temps along Ecuador driven by 2 Kelvin Waves (discussed above). And as third WWB started building as of March 8th with east anomalies starting to develop over the Maritime Continent (all classic signal of a developing El Nino) and a change in the Walker Circulation. All the model suggest some form of El Nino developing ranging from weak to strong if not super El NIno status in late Fall 2026. The million dollar question, is not will it evolve, but rather how strong will it be? Will it stall like the 2023 El Nino, of will it be given the chance to fully express what is likely the significant latent heat signature present in the ocean. El Nino is the planets way to bleed off that excess heat, by discharging it to the atmosphere. We are currently in the Spring Unpredictability Barrier (late March 2026). And though all the models are screaming 'El Nino', there is a significant uncertainty as to the strength of whatever El NIno event is to eventually manifest. It all depends upon whether the oceanic change become coupled wit the atmosphere. And that would be expressed through clear signals of a change in the Walker Circulation.
Assuming a moderate to strong event develops, and assuming the current strong WWB underway in the West Pacific continues somewhat as forecast (3 months of continued west anomalies with 6-8 weeks of very strong anomalies through the Spring of 2026), it seems some signature of this event will make it into the atmosphere starting mid-June 2026 (3 months post the start of the 3rd WWB). That should feed energy into the southern hemi jetstream improving the odds for gale development in the South Pacific to perhaps normal status and erasing the previous bias towards La Nina (and therefore less gale development). So prior to mid-June, a suppressed storm track is expected, but that should build after mid-June netting a "normal" summer swell pattern relative to Hawaii and CA. But, there are alot of caveats and 'buts' in the forecast, so confidence is not high,. And in fact, the effects of the WWB and Kelvin Waves might not develop till Aug 2026. It's just way too early to know with any certainty.
KWGA/Equatorial Surface Wind Analysis (KWGA - Kelvin Wave Generation Area - The area 5 degrees north and south of the equator from 135E to 170W - The main area for generating Kelvin Waves)
Analysis (TAO Buoys): As of (5/16) 5 day average winds were strong east over the East Equatorial Pacific and moderate east over the Central Pacific and modest east over the dateline fading to calm over the KWGA. Anomalies were modest east over the East Pacific, weak west over the Central Pacific and modest west over the dateline and KWGA. (Note: These are 5 day average winds, versus realtime, so they lag what is happening today (by about 2.5 days).
2 Week Forecast (GFS Model): (5/16) Today mostly weak east anomalies were filling the KWGA. The forecast suggests more of the same but with modest west anomalies starting to build east into the far West KWGA 5/19 and progressively building east reaching the dateline 5/28 the filling the KWGA 5/30 and beyond. Previously anomalies were moderate west starting 3/8 building to moderate to strong west 3/26-4/17 for a total 6 week duration resulting in Strong Kelvin Wave #3 that is starting to impact Ecuador now.
Kelvin Wave Generation Area wind monitoring model: West and East
- MJO/WWB/Wind Projections:
OLR Models: (5/16) Currently a very weak Inactive MJO (dry air) was barely hanging on over the KWGA. The statistic model depicts the Inactive Phase (dry air) fading and gone on day 5 of the model run with with a very weak Active Phase building over the far West Pacific easing barely into the Central KWGA on day 10 then filling the KWGA on day 15 of the model run. The Dynamic model indicates a variation on the same theme. The Statistic and Dynamic models are now starting to come to consensus.
Phase Diagrams - 2 week forecast (CA and GEFS): (5/17) - Today the models depict the Active Phase was very weak over the East Indian Ocean. The statistic model has it moving the Central West Pacific 2 weeks out and very weak but with one member at modest strength. The dynamic model indicates the Active Phase moving east to the far West Pacific 2 weeks out at modest strength.
4 Week CFS Model (850 mb wind): (5/16) Today a weak Inactive contour was over the dateline with mostly weak east anomalies filling the KWGA. This pattern is hold for a few days then west anomalies and a single Active contour is to start building in from the west on 5/19 taking over the KWGA on 5/26 at weak to modest status in pockets holding till 6/2. After that a neutral MJO is indicated but with moderate west anomalies in control consolidating 6/7 holding through the end of the model run on 6/13. Looking at what has happened recently moderate or stronger west anomalies started 2/20 holding through 4/17 or roughly 8 weeks with 4.5 weeks of that at strong status (3/16-4/18). This is much shorter than originally forecast but still fairly impressive given the time of year and has resulted in large Kelvin Wave #3 pushing east. The million dollar question is: Will something strong develop in the future resulting in a Super El Nino or is modest west anomalies all we will get?
3 Month CFS Model (850 mb wind): (5/16) - using the 5th ensemble member - the mean of the 4 individual members which are all from the 00Z run - 1 run per day):
Today a neutral to very weak west wind anomaly pattern was in play over the KWGA with the Inactive Phase of the MJO exiting to the east and a new Active MJO building into the far West KWGA. The Inactive MJO is to be gone 5/19 with the Active MJO taking over on 5/22 and modest west anomalies slowly taking over the entire KWGA through the window. The Active Phase is to hold through 7/26 with generally modest west anomalies in control and pockets of moderate west anomalies 5/24-6/1 and 6/9-6/23 and strong west anomalies 7/9-7/25. The Inactive Phase is to follow 6/9 isolated to the far West KWGA finally taking over the KWGA 7/27 through the end of the model run on 8/13. But, west anomalies are to hold at moderate status 8/1-the end of the model run. The low pass filter indicates the leading edge of the low pressure bias has been stalled the past week over the West Pacific at 178E but now is starting to track east on 5/16 reaching 130W in early June with a second contour setting up on the dateline 6/11 and a third on 7/11. A fourth has again faded from the charts. The trailing/west edge of the high pressure bias is racing east from 130W today with 1 contour (a second contour dissipated on 3/22) and is retreating fast to the east and gone from the KWGA and is to reach 120W early June. East anomalies started building over the Maritime Continent 3/8 and are to continue filling it through the end of the model run weak if not gone during Active Phases and rebuilding during Inactive Phases. A wholesale pressure pattern change appears to be well underway with a potential shift in the tradewind pattern following directly.
CFSv2 3 month forecast for 850 mb winds, MJO, Rossby etc - Alternate link
Subsurface Waters Temps
TAO data: Today (5/17) in the far West Pacific the 30 degree isotherm was easing east from 172E to 176W. The 29 degree isotherm was easing east from 170W to 155W. The 28 deg isotherm line was now reaching the whole way across the Pacific to 95W. An amazing push of warm water has moved east. The 24 deg isotherm was 125m deep at 140W and thickening steadily while pushing into Ecuador at 52m down. Anomaly wise this strong change is reflected down at the thermocline (-150m) with a Kelvin Wave #3 and +6 degs erupting to the surface in the East Pacific and +4 deg anomalies or more tracking east for from 165W. Kelvin Wave #3 is erupting now with lots of warm water behind it. The hi-res GODAS animation posted 5/13 reflects this strong change too with a huge Kelvin Wave with +4-5 degs anomalies at the thermocline (-150m) from 180W to Ecuador and up to +7 degs in it's core from 155W eastward and erupting to the surface in the East Pacific at 85W. Warm anomalies continue filling the entire subsurface Pacific. The GODAS animation is 1 week behind the TAO data but also is more detailed and accurately depicted since its satellite based.
Sea Level Anomalies: (5/13) Sea heights over the entire equatorial Pacific were impressive east of 155E positive from there pushing into Ecuador and radiating north and south along the South American Coast up to +25 cms. Kelvin Waves #1 & #2 have already hit (priming the proverbial pump). Kelvin Wave #3 was filling the entire Equatorial Pacific from Ecuador to 150E with a large area of +10 cms anomalies between 90W-170W.
Upper Ocean Heat Anomaly Histogram (5/13) indicates warm anomalies were filling the equatorial Pacific impacting Ecuador (80W). In December '25 warm anomalies and Kelvin Wave #1 started pushing east impacting Ecuador late Feb. Kelvin Wave #2 pushed east in Jan and is still impacting Ecuador now but past its prime. Kelvin Wave #3 started impacting Ecuador 5/1 driven by previous westerly anomalies. A clear sign of discharge was indicated in the west starting late March and much stronger again in mid-April and just now showing the faintest signs of starting to recharge. This is still concerning. Recharge must occur if this El Nino is to verify.
Surface Water Temps
The more warm water in the equatorial East Pacific means more storm production in the North Pacific during winter months (roughly speaking). Cold water in that area has a dampening effect. Regardless of what the atmospheric models and surface winds suggest, actual water temperatures are a ground-truth indicator of what is occurring in the ocean. All data is from blended infrared and microwave sensors.
Satellite Imagery
Hi-res Nino1.2 & 3.4 Qualitative Analysis: (5/16) In the latest image El Nino was building indicated by warm anomalies filling the entire equator Pacific with 3 pockets of very warm anomalies from Peru up to Ecuador and to a bit east of the Galapagos and building in coverage slightly today perhaps indicative of Kelvin Wave #3 erupting there now. Moderate warm anomalies were west of there to New Guinea. The ocean is showing clear signs of El Nino and the atmosphere will be 3 months behind (roughly mid-June). Alternate SST Anomaly (Global Mean): This chart is now showing the development of El Nino too with warm anomalies on the equator from Ecuador to well west of the dateline, weakest near 130W with cool anomalies south of the equator there and warmest off Ecuador to the Galapagos.
Hi-res 7 day Trend (5/16): Small pockets of warming were along the coast of Peru up to the Galapagos, then cooling slightly over the Galapagos, then warming slightly from there to the dateline.
Nino1.2 Daily CDAS Index Temps: (5/17) (The official OISST temps are 'corrected' to the most recent 30 year base period where this data is less aggressively corrected). Today's temps were rising to +1.812 up from +0.967 on 5/3. Previously temps had fallen from +1.754 (4/23) down to +1.014 (4/30). Previously they were steady near +1.0 from 2/19-4/7. Before that temps had been on a generally upward trend since 2/2. Previously temps were +0.010 (1/28) up from -0.320 (1/22). Temps had been rising 1/1-1/16, previously down at -1.596 12/30, up at -0.820 (12/20), that up from -1.453 4 days previous (12/19) but had been falling steadily since 12/2.
Nino 3.4 Daily CDAS Index Temps: (5/17) Today's temps were rising again at +0.808 after being up to +0.838 (5/2), then +0.597 since 4/23, rising 10 days prior after reaching dead neutral (0.0) on 4/2, the first time in a very long time. Temps have been rising steadily since 1/11, at -1.267 12/27 falling from -0.922 (12/7), rising since 11/26.
Weekly OISST Anomalies were rising at +0.9 (4/29 & 5/6) +0.4 both weeks on the relative scale (weekly RONI). Previously temps were +0.7 (4/22), +0.5 (+0.1 relative 4/15), +0.2 (3/25, 4/1 & 4/8), 0.0 degs (March 11 & 18), -0.1 (3 weeks 2/18-3/4), -0.2 (2/11), 0-0.5 (2/4), -0.4 (1/28), -0.3 (1/21), -0.7 (1/14), -0.8 (1/7), -0.5 (12/31), -0.7 (12/24), -0.8 (12/17), -0.7 (12/10), -0.5 (12/3),. -0.6 (11/26), -0.8 (11/19), -0.7 (11/5 & 11/12), -0.6 (10/15, 10/22 & 10/29), -0.3 (10/8), -0.5 (9/24 & 10/1), -0.4 (9/17), -0.5 (9/10), -0.3 (9/3), -0.4 (8/20 & 8/27).
Monthly Data is +0.36 April, +0.09 March, -0.12 Feb, -0.41 Jan, -0.57 Dec, -0.64 Nov, -0.50 Oct, -0.45 Sept, -0.32 Aug, -0.10 July -0.01 June, -0.02 May, -0.02 April, +0.11 March, -0.28 Feb, -0.56 Jan.
3 Month ONI (relative centered) 3 month period is -0.48 FMA, -0.71 (JFM), -0.88 (DJF), -0.97 (NDJ), -0.93 OND, -0.87 SON, -0.77 (ASO). -0.63 (JAS), -0.47 (JJA), -0.43 (MJJ), -0.49 AMJ, -0.52 (MAM), -0.67 (FMA), -0.89 (JFM), -1.12 (DJF), -1.07 (NDJ), -0.92 (OND).
 |
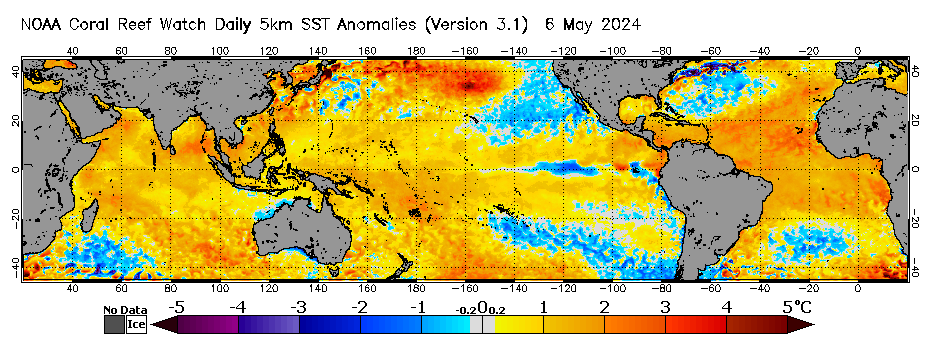 |
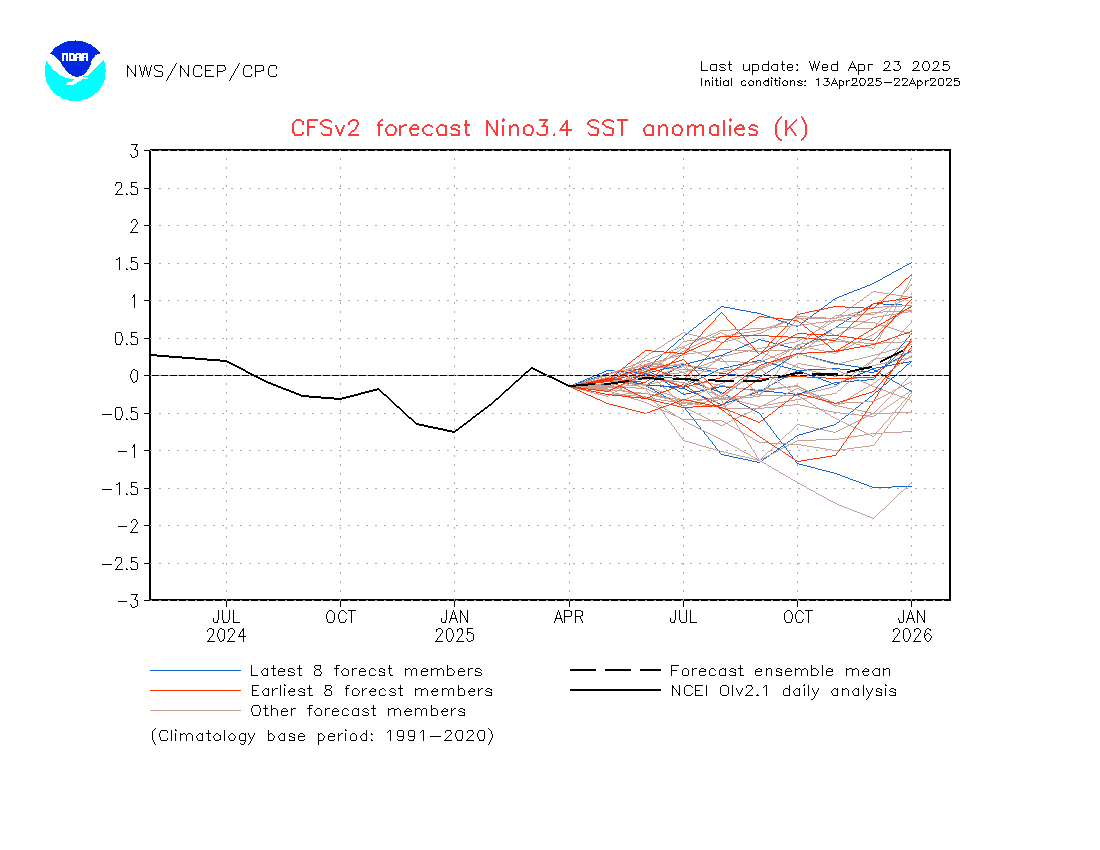
CFSV2 Forecast for Nino3.4 Sea Surface Temp (SST) Anomalies & Current SST Anomalies SST Anomaly Projections
CFSv2 Data (Nino3.4 Region)
Previous - Temps rose unexpectedly to +0.025 in March then faded only to -0.1 in April (far less that the -0.40 forecast) then steady at 0.00 in May-June. Temps started falling in mid-July down to -0.3 in Aug, -0.45 Sept and -0.40 in Oct. Sea Surface Temp Anomalies for Nov did NOT fall nearly as hard as previously forecast (forecast was -0.95 but actual was -0.7) and then did not fall in Dec (forecast at -7.0 actual was -0.6). but Dec was forecast at -0.6 and actuals were -0.75. Late Jan temps were -0.45 and -0.2 in Feb and 0.0 in March and +0.3 in April.
Forecast (5/17) - Temps are forecast rising dramatically from here forward, to +3.35 Oct-Dec peaking at +3.5 Nov 1 then +2.3 at the end of the model run Feb 2027. At the other end of the spectrum the PDF & Spread Corrected forecast suggests the same trend but with temps rising to only +2.00 in Nov and +1.1 in Feb. The Relative forecast has temps peaking at +2.90 degs in early Dec. It looks like we are moving into some flavor or El Nino, but split anywhere from strong to 'super' status.
IRI Consensus Plume: The April 20, 2025 Plume (all models) depicts temps are rising fast at +0.622 today (AMJ). Temps to rise to +0.928 in MJJ and and 1.647 OND. This is up 0.5 degs since last month. The Dynamic model suggest temps rising to +2.060 OND then falling to +1.810 at the end of the model run. The Statistic model suggests temps rising to +1.298 MDJ and 1.265 at the end of the model run. Per the average of all models, we are at weak El Nino status today and moving to maybe minimal strong El Nino status in the Fall.
See chart here - link.
Atmospheric Coupling (Indicating the presence of El Nino in the atmosphere driven by the ocean):
Southern Oscillation Index (SOI) (negative is good, positive bad - all but the Daily Index is a lagging indicator the 30 day average lagging 15 days and the 90 day average lagging 45 days):
Today (5/17) the Daily Index was -27.48 and and has been effectively negative since 3/25 and at times very negative (-30 or less).
The 30 day average was falling some from -8.81 peaking down at -10.05 4/28. and has been falling from -7.53 a month ago.
The 90 day average was falling some at -1.36 turning negative the first time in a very long time on 5/14 at -0.07 and in neutral territory. It was +4.52 a month ago.
Pacific Decadal Oscillation (Negative is bad, Positive is good)
Past Recent History: The PDO theoretically turned from a warm (positive) trend in Spring of '98 and has cool (negative) mostly since then other than turning weakly positive March 2014-June 2017. It went hard negative in 10/2021-10/2023 driven by a 3 year La Nina conditions (down to -3.13). It started rising (but still negative) 11/2023-2/2024 driven by a strong El Nino, but not enough to even get it to break positive ground (best reading at -1.33 on 2/24). It then started falling in March 2024 down to -3.56 Sept (the lowest since April 1859) and -3.80 (Oct) the lowest ever reported. But in Nov the index final rose some to -3.13 and -2.03 in Dec 2024 and -1.29 in Jan 2025.
Current Situation: The index was steady in April at -1.25, March -1.44, Feb -1.01, Jan -1.26, Dec 2025 -0.96, -1.51 Nov, -2.37 Oct, -2.31 Sept (and in line with average readings since Nov 2021), -3.23 Aug after falling hard in July at -4.21 (the lowest ever), -2.64 June, -1.66 May, -1.15 April, -1.12 March and -1.45 Feb 2025. Looking at the long term record, it seems likely we are stable and still in the Cool Phase of the PDO (La Nina 'like') since 5/1998 with no sign of moving to the positive/warm phase (El Nino 'like') of any meaningful duration yet. We need at least 3 months of -1.2 or higher values before one could guess that maybe the cool phase is weakening.
See imagery in the ENSO Powertool
Local Interest
Stormsurf Video Surf Forecast for this week. See it Here
For automatic notification of forecast updates, subscribe to the Stormsurf001 YouTube channel - just click the 'Subscribe' button below the video. - - -
ESPN Sports Center 'Ride of a Lifetime' - The backstory of Alo Slebir's possible 100+ ft wave at Mevericks - https://www.youtube.com/watch?v=luQSYf5sKjQ
NBC News - Climate Change and Surfing: https://www.nbcnews.com/mach/science/climate-change-good-surfing-other-sports-not-so-much-ncna1017131
Mavericks & Stormsurf on HBO Sports with Bryant Gumbel https://www.youtube.com/watch?v=luQSYf5sKjQ Pieces Featuring Stormsurf:
http://www.bloomberg.com/video/how-to-predict-the-best-surfing-waves-EsNiR~0xR5yXGOlOq2MqfA.html
http://www.cbsnews.com/videos/surfs-up-for-mavericks-invitational-in-calif/ Time Zone Converter By popular demand we've built and easy to use time convert that transposes GMT time to whatever time zone you are located. It's ion left hand column on every page on the site near the link to the swell calculator. Surf Height-Swell Height Correlation Table |