|
|||
|
|||
|
|
|||
|
|||
|
Texas Surf Report
This surf report contains buoy data and images that depict the current state of the ocean and atmosphere in the Texas and Gulf of Mexico swell window. Use this page to track storms, observe arriving swells, and determine winds and tides at your beach.
Also see Buoy Data, Current Weather & Tropical Update
About Powertools & Links
**Links open a new window. When finished viewing, close the window and select another**
Surf Cams
Arranged
from North to South
| Camera Location | Refresh Rate/Provider |
| Galveston | Every 10 mins GalvestonSurfCam.com |
| Upper Texas Coast (Galveston) | Every morning g-townsurf.com |
| Surfside | Every 10 minutes Netsurfing.com |
| Corpus Christi | Every 60 secs SurfCorpus.com |
| South Padre Island | Every 60 secs (go to bottom of page) Spadre.com |
Stormsurf Buoys
(Click a buoy for detailed swell and surf data)
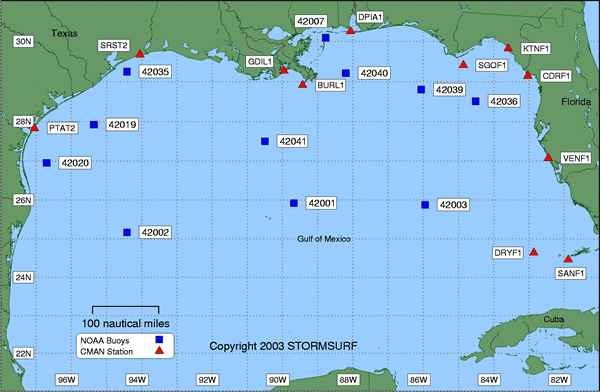
|
Buoys
Arranged
from North to South
Courtesy: NBDC & NOAA OMB
Current Observations Swell Forecast Buoy Number Buoy Name Primary Observation Secondary Observation Spectral Density of Current Observation 6 hr Hindcast & 180 hr Forecast
(NOAA OMB)GULF OF MEXICO
OffshoreTo view buoy locations select a Buoy Map: Buoy Map East
& West42003 Eastern Gulf of Mexico Buoy NDBC Wave Met Spec Dens Forecast 42001 Middle Gulf of Mexico Buoy NDBC Wave Met Spec Dens Forecast 42002 Western Gulf of Mexico Buoy NDBC Wave Met Spec Dens Forecast Nearshore SRST2 Sabine NDBC 42035 Galveston Buoy NDBC Wave Met Spec Dens Forecast 42019 Lanelle Buoy NDBC Wave Met Spec Dens Forecast PTAT2 Port Aransas NDBC 42020 Eileen Buoy NDBC Wave Met Spec Dens Forecast
- NDBC = National Data Buoy Center - Primary Source for Wave and Wind Observations
- Wave Met = Links to the NDBC FTP server which is often up when the prime web server is down.
Two links provided: One to detailed 'Wave' data, the other to 'Meteorlogical' data (including Significant Sea heights). Heights are in meters, Time in GMT/UTC. Field descriptions can be found here: Wave Met- Spec Dens = Links to the National Data Buoy Center. Dispalys the amount of energy in each spectral band by period.
- Buoy Forecast is from the Wavewatch III Wave Model courtesy of NOAA OMB.
Tabular display tracks up to 6 swells as they converge on any buoy simultaneously. Identifies Significant Wave Height, Swell Height, Period and Direction hourly for the previous 12 hours and 72 hours into the future. Wherever possible, the Regional Model is used to increase accuracy. Heights are in meters, Period in seconds. Direction indicates where the swell is heading. Add or substract 180 degrees to calcuate where it came from.
Spectral Density
(Buoy 42019)
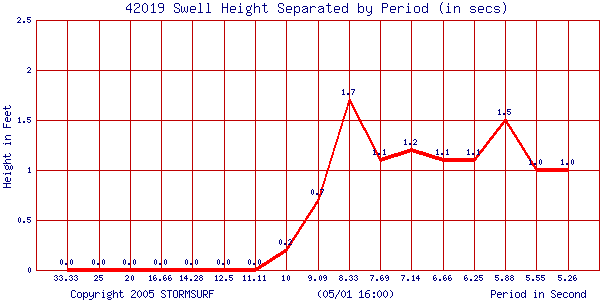 |
Swell Trend
for Buoy 42019
Lanelle Buoy
Courtesy: National Data Buoy Center (NDBC)
Swell Height (in ft) & Period (in secs)
North Atlantic GOES-8 Infrared Satellite
Image
Courtesy: UNISYS/University of Purdue
 |
Wind
Conditions via RUC2 Model
(updated every 3
hours)
Courtesy: NOAA FSL
 |
Current
Global Winds Via QuikSCAT Satellite Based Sensors
(Ascending Pass)
Courtesy: NOAA OPPT
 |
Local
Marine Wind Conditions Via QuikSCAT Satellite Based Sensors
(Ascending Pass)
Courtesy: NOAA OPPT
 |
Current
00hr NOAA Wavewatch III Wave Model
Courtesy: NOAA OMB
| Height | Period |
 |
 |
Current
Southeast US/Gulf of Mexico Regional NOAA Wave Model
Courtesy: NOAA OMB
| Height | Period |
 |
 |
Current Gulf of Mexico Navy Wave Model
Click the link and accept the certificates: Navy
Stormsurf Buoy Forecasts
(Click a buoy for detailed swell and surf data)
|
Tides
Courtesy: Biological Sciences, University of South
Carolina
5565
|
|||||||
|
|||||||
