Iceberg B15A Breakup Chart and Analysis Run the Numbers and Decide for Yourself
There appears to be some debate about the recently publish article in magazine Geophysical Research Letters concerning the breakup of iceberg B15A in the Ross Sea and the potential contribution to the breakup caused by swell originating from Storm #1 in the Gulf of Alaska in the Fall of 2005. Below we've provided information for the inquisitive to research further.
Here's the hi-resolution time lapse local wave model from Gulf of Alaska Storm #1 that generated swell discussed as contributing to the breakup of B15A. Note sea heights and locations at the peak of the storm.
Here's the actual storm description we provided soon after it's demise (below). More data can be found here in our archive.
Storm #1 Storm History
On Wednesday (10/19) a low in the Bering Sea started to respond to the dip in the jetstream and sank southeast towards the Gulf of Alaska with another low from Siberia tracking quick east, join it along with a little low pushing north from Hawaii. All converged in the evening sputtering to life as one consolidated large complex storm in the Gulf with pressure 984 mbs. Strong high pressure was building west of it at 1028 mbs setting up a broad and steady fetch of 35-40 kt winds confirmed centered near 47N 167W aimed mid-way between Hawaii and California. Seas were on the increase.
On Thursday (10/20) additional energy dropped southeast from the Bering Sea into the Gulf driving pressure down to 968 mbs while high pressure to the west built to 1032 mbs moving closer to the storm, generating a strong gradient with 55-60 kt winds confirmed in the lows southwest sector centered near 49N 158W and aimed 35 degrees south of the 308 degree path to Northern CA (311 SCal) and 45 degrees east of the 359 degree path to Hawaii. Seas were an inconsequential 23 ft and quickly on the increase. By night fall pressure was down to 960 mbs with up to hurricane force winds confirmed over the exact the same area centered at 49N 157W aimed just like in the morning (55-60 kts with a few barbs to 65 kts). The fetch was not large but was steady covering the exact same 661 nmiles long fetch as in the morning. Winds were therefore getting good traction on the oceans surface. Seas were modeled at 41 ft centered at 48N 155W and on the increase with the MPC suggesting seas to 45 ft, though ar first blush that seems a little high. But the Jason-1 satellite made a pass right over the core of the fetch and reported seas at 40 ft at 06Z centered at 44N 155W before the altimeter stopped providing data due presumably to rain contamination. So the 45 ft height is probably closer to real.
By early Friday morning (10/21) the storm was fading with pressure up to 966 mbs and winds down, confirmed at 45-50 kts centered at 48N 150W aimed 10 degrees south of the 306 degree path to North CA (308 SCal) and 50 degrees east of the 7 degree path to Hawaii. Seas maxing at 44 ft centered at 47N 153W on the 302 degree track to NCal with MCP suggesting 48 ft. Given the earlier Jason reading we're going with the MPC data. A quick decline starting Friday night with pressure up to 974 mbs and winds down to 40 kts centered at 52N 145W. High pressure that was off the storms west side was diving south towards Hawaii while seas from previous days fetch decayed to 37 ft at 45N 148W pushing straight down the channel mid-way between Hawaii and California. MPC indicated seas 39 ft at 45N 150W.
Swell hit buoy 46036 off Southern Canada at 5 PM PDT Friday evening with period at 17 secs and seas quickly ramping up to 24 ft @ 17 secs by 8 PM.
Swell also hit buoy 46006 at 7 PM Friday with period at 17 secs ramping up with seas 21.6 ft @ 17 secs and pure swell 16.2 ft @ 19.2 secs by 9 PM. This is just a few hours back from our expectations. Size ramped up through the night peaking near 4 AM with seas 24-27 ft @ 20 secs and pure swell 18.5-20.0 ft @ 19-20 secs and holding through at least 8 AM. This is exactly as expected. Most impressive.
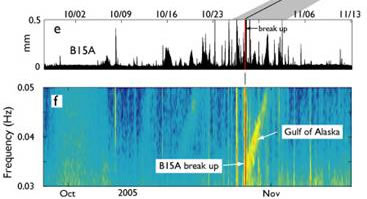
Here's the output from the seismometer imbedded in iceberg B15A before, during and after the time of breakup: Notice the presence of 0.03 Hz energy (33 sec period) at the iceberg just before breakup, moving towards the .035 Hz range at breakup (28.6 secs) at 21Z on 10/27/05, then slowly trailing off days later.to 0.05 Hz (20 secs) approx 10/31. The way the spectrograph is produced, no energy less than 25 secs is displayed. The imaged energy fits the profile of a swell that has traveled very far as evidence by the lengthy decline in energy over a multi-day timeframe.
Run the numbers yourself: Let's hindcast the swell and see if it's profile approximates the observed profile at the iceberg.
Using the Stormsurf Swell Calculator (click here to open in a new window) enter the icebergs coordinates: 70S 178E in 'Your Location'.
For the Start Date/Time enter Month: 10 Day: 21 Year:2005 and Start Time 0300 (GMT)
For Storm Location #1 enter 47N 155W with Max Sea Height 45 ft (we bumped up the numbers 1 ft from the wave model hindcast based on the observed data discussed in our forecast).
For Storm Location #2 enter 45N 151W with Max Sea Height 40 ft
Click 'Calculate Distance': Notice the 2 travel distances are 7118 nmiles and 7032 nmiles respectively (from the iceberg to the core of the highest seas) with a heading of 20 degrees relative to the iceberg (please note there's a bug in the software. Subtract 6 degrees for the real heading).
Next click 'Calculate Swell Arrival Time': Notice that 25 sec energy is predicted to arrive at the iceberg starting Friday Oct 28 at 17Z. The calculator is not constructed to account for 33 sec periods, so we'll fill that gap for you now. The arrival time at the iceberg would be 21Z on 10/26/05. Iceberg breakup was on 21Z 10/27/05 or approx 24 hours later. Further notice the transition to 20 sec frequency is predicted at Sun Oct 30th between 14 and 23Z.
Decide for yourself: Let's see if the if the predicted swell profile matches the observed profile with a reasonable degree of fit. Using the data above the swell was forecast to hit B15A early on 10/27 (assuming at 30 sec period) and it appears it did. Next we follow the period decay profile to see how close it matches reality. Transition to 25 secs (0.04 Hz) was predicted at about mid-day 10/28 and to 20 secs (0.05 HZ) at Sun 10/30.The observed data appears to fit that profile.
Next let's assess whether swell from a more local source could have contributed. The observed record above indicates no presence of lesser energy (though the graph doesn't depict energy in the higher frequencies (less period) so that open for debate. But any storm half as close and equally powerful would have produced a profile that decayed from the higher to the lesser energy levels twice as fast. There is no record of that occurring in the image above.
Clearly this is not the final say on this issue, but just food for thought. There are a host of other issues that could sway ones opinion, but the data seems to suggest that the energy hitting the iceberg at the time of breakup came from Storm #1 in the Gulf of Alaska. Whether that actually caused the breakup is altogether another issue though.